
|

|
|
|
Mikes RV-9A Web Site
|
Date: 7-26-2010
|
Number of Hours: 2.00
|
Manual Reference:
|
Brief Description: 2nd Flight
|
|
Removed cowl and inspecting engine & aircraft. No squawks!
Flight Test 2 – 2 Hr Duration
7/26/10
OAT 91 Deg F
AC CG=79.01” (Forward limit is 78”)
At rotation: Max RPM 2690
It takes a forceful stick pull to pick the nose off the ground.
Very minor nose down trim from neutral position during climb out.
Climbed to 2500 ft at FT and 2600 RPM, (100 mph IAS) at which point max CHT hit 425.
Increased speed to 130 MPH and reduced prop to 2400 RPM, then max CHT reduced to 400.
Continued climb to 3500 ft, leveled off with FT (26”/2400 RPM) (82% Pwr).
Leaned to find peak EGT (~1430) then enriched mix to 1300 EGT (~125 rich of peak)
IAS stabilized at 152 MPH and TAS 173 MPH. Fuel flow was 11.5 gph.
CHT’s stabilized between 400 to 365 (hi to lo), OAT 91 Deg, OT stable at 183 Deg F.
Ran race track for 1 hr between UAO and Mulino (PDX Approach complained that I was passing back and forth through the PDX letdown area) so I moved to UAO northward for the next 45 min. Air was very rough, so was unable to take any stabilized data.
At 1.75 hrs, performed 2 full flap stalls, with break occurring at 48 MPH IAS. Very minor buffet before the break. Pre-stall buffet was much more pronounced when at 20 Deg flap.
The AFS AOA predicts stall condition correctly at present time without having yet been flight calibrated.
With the constant speed prop I’ve noticed that as MP is reduced, the airplane immediately slows down. There appears to be very little “coasting” to get the plane to slow down. Perhaps some of this is associated with not yet having main wheel pant and leg fairings, such that there is still a lot of drag present.
It’s just very interesting and quite different than the LEZ, where it took quite some time to get the plane to slow down after power reduction. After 5 hrs of flight time, I can operate at “SQ” power, so will put all the fairings on after the 3rd Flight Test. At that point, I can start acquiring performance data.
Pattern approach was done at 120 mph, throttle back to 90 mph a
|
|
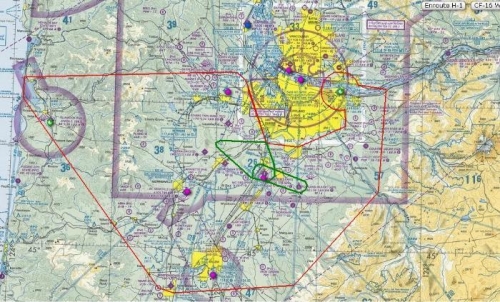
Red is Flight Test Area, Green is todays flight
|
|
|
|
|
|
|
|
|
Copyright © 2001-2024 Matronics. All Rights Reserved.
|